Energy Optimization Guide
Cut Packaging Energy Costs by 30%: The IBM-Air Compressor Integration Playbook
Packaging plants bleed energy through compressed air systems that were never optimized for their actual production profile. An Injection Blow Moulding (IBM) Machine paired with a mismatched air compressor wastes 25-40% more electricity than necessary, inflating operating costs and eroding margins in an already competitive market. This guide delivers the engineering strategies that slash energy consumption while maintaining the precision air supply that IBM processes demand.
Whether you run a high-volume IBM175 machine or a multi-machine packaging hall, the integration between your blow molding equipment and compressed air system determines your energy destiny. The solutions here are field-tested, quantified, and immediately actionable.
Why IBM Machines Demand Smarter Air Compressor Strategies
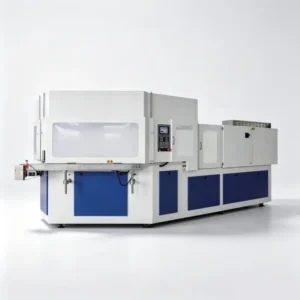
Injection Blow Moulding (IBM) is a precision process that injects molten polymer into a preform mold, then transfers the preform to a blow mold where compressed air inflates it into the final bottle shape. Unlike extrusion blow molding, IBM produces bottles with superior wall thickness distribution, precise neck finishes, and zero flash waste. These quality advantages come with a specific compressed air signature that differs fundamentally from other blow molding technologies.
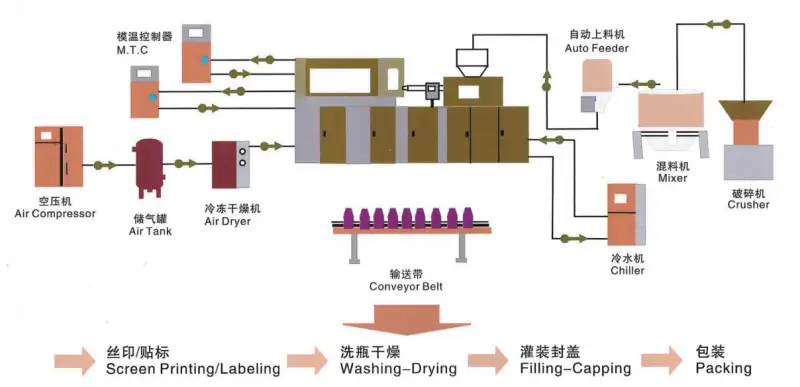
IBM machines operate in discrete cycles with distinct air demand phases:
●Pre-Blow Phase (Low Pressure)
Air at 8-12 bar pre-stretches the preform before high-pressure inflation. This phase consumes 30-40% of total cycle air volume but at moderate pressure.
●High-Pressure Blow Phase
Air at 25-35 bar completes the blow, forming the bottle against the mold cavity. This phase is short-duration but pressure-critical—any fluctuation causes wall thickness defects.
●Recovery and Exhaust Phase
Blow air is vented to atmosphere, creating a demand trough. The compressor must unload or throttle efficiently during this phase to avoid energy waste.
●Idle Between Cycles
Mold cooling, part ejection, and preform injection create periods of zero air demand. Fixed-speed compressors running unloaded during these periods consume 20-35% of full-load power.
This cyclical demand profile—peaks of high flow and pressure followed by troughs of near-zero demand—is kryptonite for fixed-speed compressors. A compressor sized for peak demand runs inefficiently at partial load for 60-70% of the operating cycle. The energy waste is not incremental; it is massive. For facilities evaluating energy-efficient blow molding air compressor solutions, understanding this demand signature is the starting point for optimization.
Quantifying the Energy Waste in Conventional IBM-Air Systems
Before implementing solutions, quantify the problem. Most packaging plants have no idea how much energy their compressed air systems waste because they never measure it. The following analysis provides a framework for calculating actual waste in your facility.
Baseline Energy Audit Methodology:
- Install power meters on each compressor motor for 7 days of normal production
- Record compressor load/unload cycles and duration
- Measure actual air demand using calibrated flow meters at the IBM machine connection
- Log production output (bottles per hour) during the monitoring period
- Calculate specific energy consumption: kWh per thousand bottles produced
Typical findings from audits of packaging plants running IBM machines:
| Energy Waste Source | Typical Magnitude | Annual Cost Impact (100kW System) |
|---|---|---|
| Unloaded running (fixed-speed) | 20-35% of full-load power during 40-60% of operating hours | $8,000-$18,000 |
| Excess system pressure (10% above minimum) | 6-8% power increase per 1 bar above requirement | $6,000-$12,000 |
| Air leaks (typical 20-30% of capacity) | 15-25% of total compressor energy | $14,000-$24,000 |
| Pressure drop across filters and dryers | 3-8% power increase from loaded filters | $3,000-$8,000 |
| Inadequate receiver sizing | Forces compressor to cycle more frequently, reducing efficiency | $2,000-$5,000 |
| Heat rejection waste (no recovery) | 60-80% of input energy rejected as heat with zero recovery | $50,000-$150,000 (opportunity cost) |
The total annual waste for a typical 100 kW system serving IBM machines is $33,000-$67,000 in direct energy costs plus $50,000-$150,000 in lost heat recovery opportunity. Over a 10-year period, this represents $830,000-$2.17 million in avoidable cost—far exceeding the capital cost of an optimized compressor system. The business case for energy optimization is not marginal; it is transformative.
Variable Speed Drives: The Single Most Impactful Upgrade
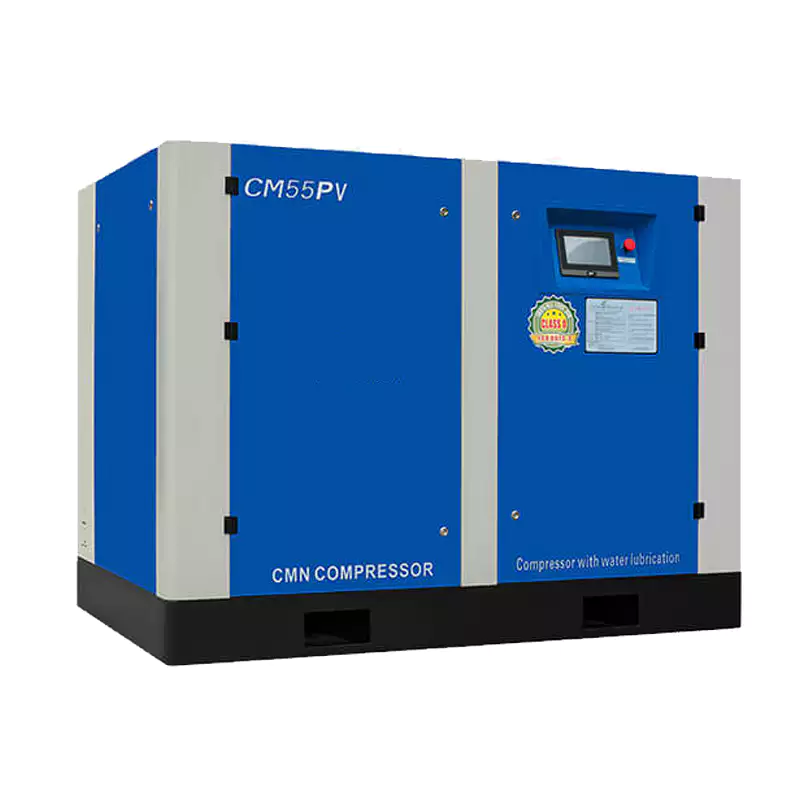
Variable Speed Drive (VSD) technology transforms compressor efficiency by matching motor speed to actual air demand. For IBM machines with cyclical demand, VSD eliminates the unloaded running waste that dominates fixed-speed compressor energy consumption.
How VSD Works for IBM Applications:
A VSD compressor uses a frequency inverter to vary motor speed from 30% to 100% of rated RPM. As IBM air demand drops during mold cooling and part ejection phases, the compressor slows down, reducing power consumption proportionally. At 50% speed, power consumption drops to approximately 25% of full load (following the cube law for centrifugal loads, though screw compressors follow a slightly different curve). This is dramatically more efficient than fixed-speed compressors that continue running at full speed while unloading, consuming 20-35% of full-load power during zero-demand periods.
Real-World Performance Data:
- Fixed-speed compressor at 60% average load factor: specific energy = 0.22 kWh/Nm³
- VSD compressor at same average load factor: specific energy = 0.16 kWh/Nm³
- Energy reduction: 27%
- For a system consuming 500,000 Nm³/year: annual savings = $3,600 at $0.12/kWh
- For a 200 kW system: annual savings = $14,400-$28,800 depending on load profile
The payback period for VSD retrofit or upgrade is typically 1.5-3 years for IBM applications with significant demand variation. For new installations, the VSD premium (15-25% above fixed-speed capital cost) is recovered within the first year of operation in most packaging plants.
VSD Sizing Considerations: VSD compressors have a minimum stable speed, typically 30-40% of rated speed. Below this threshold, the compressor may surge (centrifugal) or experience excessive oil temperatures (screw). For IBM applications with extreme demand variation, consider a hybrid configuration: a VSD compressor handling base load with a small fixed-speed compressor as trim unit for peak demand spikes. This prevents the VSD from operating below its stable range while maximizing energy savings across the operating envelope.
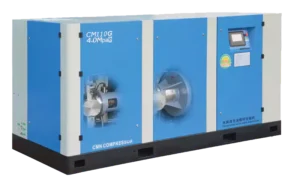
Ever-Power’s CM-PV series oil-free screw compressors are available with integrated VSD drives optimized for blow molding demand profiles. The variable speed control algorithm anticipates demand spikes from IBM cycle patterns, maintaining stable discharge pressure within ±0.2 bar while minimizing energy consumption. For facilities running high-cycle IBM equipment, this predictive control eliminates the pressure fluctuations that cause bottle quality variation.

Heat Recovery: Turning Waste Into Value
Air compressors reject 60-80% of input electrical energy as heat. In a typical packaging plant, this heat is vented to atmosphere—pure waste. Heat recovery systems capture this energy and redirect it to useful applications, transforming the compressor from an energy consumer into a combined heat and power asset.
Heat Recovery Applications in Packaging Plants:
→Process Water Preheating
Compressor heat exchangers can preheat water for IBM mold temperature control systems from 20°C to 50°C, reducing boiler fuel consumption by 15-25%.
→Space Heating
Hot cooling air or water can heat packaging halls, warehouses, and administrative areas during cold seasons, offsetting natural gas or electric heating costs.
→Absorption Cooling
Hot water from compressor heat recovery can drive absorption chillers for process cooling or air conditioning, converting waste heat into cooling capacity.
→CIP System Preheating
Clean-in-place systems for filling lines and conveyors require hot water. Compressor heat recovery can provide 40-60% of CIP heating requirements.
Economic Quantification: A 100 kW compressor generates approximately 70 kW of recoverable heat. At 6,000 operating hours per year and $0.08/kWh heating value (natural gas equivalent), annual heat recovery value is $33,600. The capital cost of heat recovery equipment (heat exchangers, pumps, controls) is $8,000-$15,000, yielding a payback period of 3-6 months. Over 10 years, heat recovery generates $336,000 in value—more than triple the initial compressor capital cost.
Water-cooled compressors are particularly well-suited for heat recovery because the cooling water captures heat at a higher temperature (40-60°C) than air-cooled exhaust (30-50°C). For packaging plants with existing boiler systems, water-cooled compressors with heat recovery integration should be the default specification. For plants without water infrastructure, air-cooled heat recovery systems still capture 40-60% of available heat through ducting and heat exchangers.
System Pressure Optimization: The Hidden Efficiency Lever
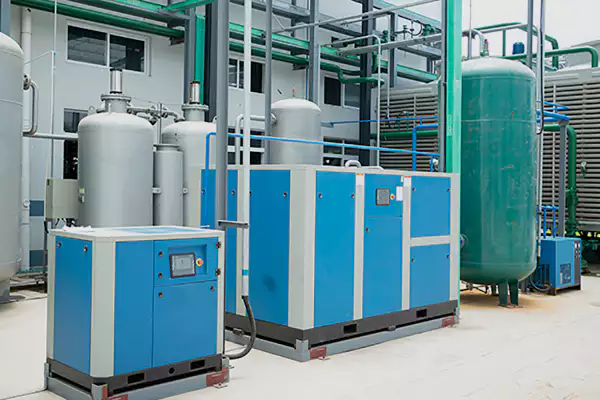
Most packaging plants operate their compressed air systems at pressures higher than necessary. Every 1 bar of excess pressure increases compressor power consumption by 6-8%. For IBM machines, the minimum required pressure is determined by the blow molding process, not by conservative engineering margins.
Pressure Optimization Protocol:
- Determine the minimum blow pressure that maintains bottle quality. Conduct trials at incrementally lower pressures (35 bar, 33 bar, 31 bar, etc.) and inspect bottles for wall thickness uniformity, dimensional accuracy, and cosmetic defects.
- Identify the pressure drop from compressor discharge to blow molding machine nozzle. Measure at full flow to account for dynamic losses. Typical losses: 0.3-0.5 bar across dryers, 0.2-0.4 bar across filters, 0.1-0.3 bar through piping.
- Set compressor discharge pressure = minimum blow pressure + total pressure drop + 0.5 bar safety margin. If the minimum blow pressure is 32 bar and total drop is 1.0 bar, set discharge at 33.5 bar—not the 38-40 bar that many plants use by default.
- Implement pressure reduction gradually (0.5 bar per week) while monitoring bottle quality. Sudden large reductions risk quality issues that are difficult to attribute.
Case Study: Pressure Reduction in a European Packaging Plant
A packaging plant in Germany operating three IBM machines reduced system pressure from 38 bar to 34 bar over six months. Bottle quality remained within specification, confirmed by wall thickness gauge measurements and customer acceptance. The 4 bar reduction decreased compressor power consumption by 22%, saving €28,000 annually on a 150 kW system. The only capital investment was time for engineering trials and pressure gauge calibration.
Pressure optimization requires coordination between the compressor supplier and blow molding machine manufacturer. The IBM175 replacement machine specification includes minimum blow pressure data that varies by bottle size, material, and production speed. Use this data as the starting point for optimization, not the compressor’s maximum rated pressure.
Leak Detection and Demand-Side Management
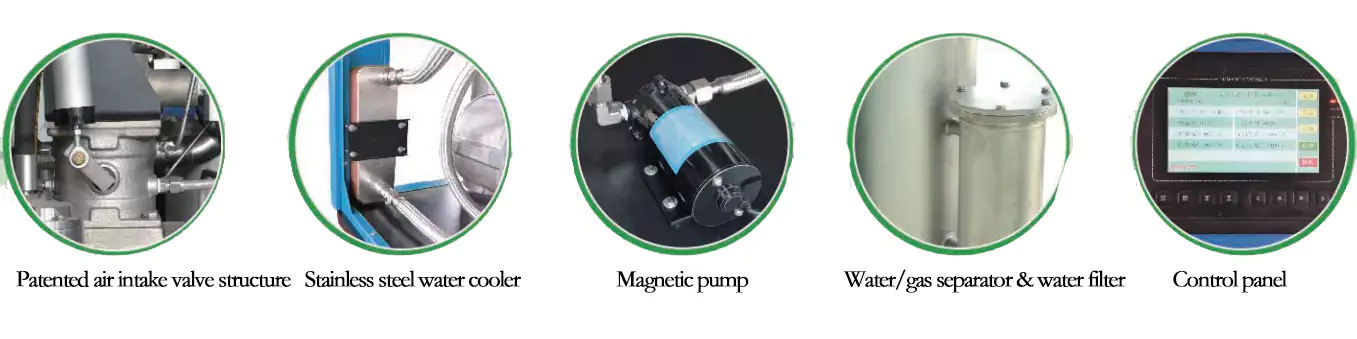
Compressed air leaks are the silent energy thief of packaging plants. At the high pressures required for IBM blow molding (25-40 bar), even small leaks waste enormous energy. A 3 mm leak at 35 bar consumes approximately 12 kW of compressor power—equivalent to $12,000 annually at 8,000 operating hours.
Leak Detection Program:
- Conduct ultrasonic leak surveys quarterly using handheld detectors. High-pressure leaks generate ultrasonic frequencies (20-100 kHz) that are inaudible but easily detected with proper instruments.
- Focus on common leak points: hose connections, quick-disconnect fittings, valve stem packings, cylinder rod seals, and filter bowl drains.
- Tag all detected leaks with priority ratings (critical, major, minor) and repair timelines.
- Measure leak reduction by comparing compressor loaded hours before and after repair campaigns. A well-executed leak program typically reduces compressor load by 10-20%.
Demand-Side Management: Beyond leak repair, optimize air consumption at the point of use:
- Install isolation valves on idle machines to prevent standby air consumption
- Replace open-blow compressed air cooling with dedicated fans or blowers for non-critical applications
- Optimize blow timing on IBM machines—minimize blow duration while maintaining bottle quality
- Recover and reuse blow air where possible (closed-loop systems for non-food-contact applications)
- Right-size nozzles and orifices to prevent excessive air consumption from oversized openings
A comprehensive demand-side management program—leak repair, consumption optimization, and production scheduling coordination—can reduce total compressed air demand by 15-30% without any capital investment in compressor equipment. This demand reduction then enables downsizing of compressor capacity or extended life of existing equipment.
Multi-Compressor Control and Load Matching
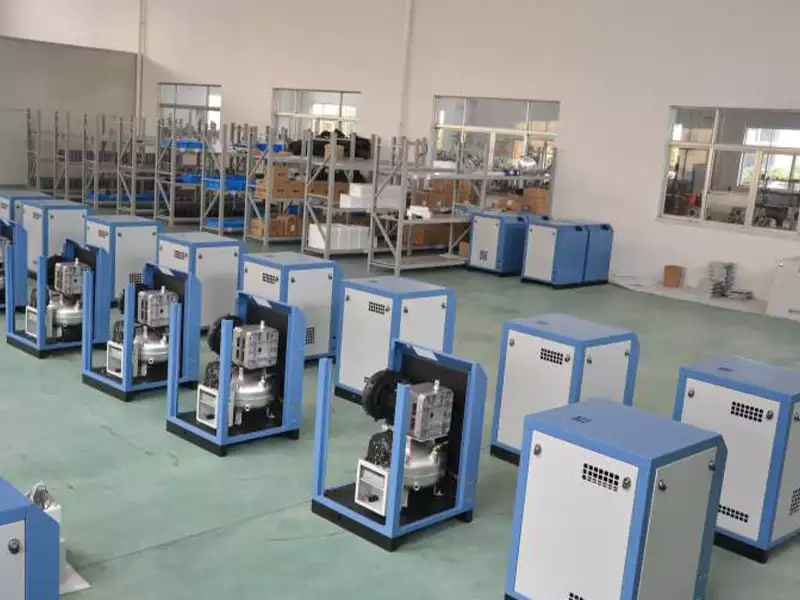
Packaging plants with multiple IBM machines rarely operate all machines at full capacity simultaneously. Production scheduling, changeovers, and maintenance create demand profiles that vary significantly throughout the day and week. A single large compressor running at partial load is inefficient. Multiple compressors with intelligent sequencing optimize efficiency across the full demand range.
Sequencing Strategies:
- Base-Trim Configuration: One large VSD compressor handles base load while smaller fixed-speed units activate for peak demand. The VSD compressor operates in its efficient range (50-100% speed) while fixed-speed units run fully loaded when active.
- Equal Wear Strategy: Rotate compressor lead assignment to distribute operating hours evenly across all units, preventing one compressor from accumulating excessive wear while others remain idle.
- Automatic Shutdown: When demand drops below the minimum efficient output of a compressor, the control system shuts it down and transfers load to remaining units. Prevents inefficient operation at the bottom of the compressor curve.
Central Control Systems: Modern compressor controllers integrate with plant SCADA systems to receive production schedule data. When the schedule shows reduced IBM machine operation during a changeover, the controller proactively reduces compressor output before pressure rises. This anticipatory control is more efficient than reactive pressure-based control that responds after energy has already been wasted.
For facilities with 3+ compressors, a master controller pays for itself within 12-18 months through optimized sequencing alone. The controller also provides data logging for energy reporting, maintenance scheduling, and fault diagnostics.
Implementation Roadmap: From Audit to Optimized System
Energy optimization is not a single project—it is a continuous improvement process. The following roadmap provides a phased approach that delivers incremental savings while building toward a fully optimized system.
✓Phase 1: Energy Audit (Weeks 1-2)
Install power meters and flow meters. Quantify actual energy consumption, load profile, and specific energy per thousand bottles. Identify the largest waste sources.
✓Phase 2: Quick Wins (Weeks 3-6)
Repair leaks, reduce system pressure, clean filters, and optimize blow timing. These no-capital or low-capital measures typically deliver 10-15% energy reduction within 30 days.
✓Phase 3: VSD Upgrade (Months 2-4)
Replace fixed-speed compressors with VSD units or retrofit existing compressors with VSD drives. This is the single largest energy-saving measure, typically reducing consumption by 20-30%.
✓Phase 4: Heat Recovery (Months 4-6)
Install heat exchangers and recovery systems. Capture 60-80% of compressor waste heat for process water heating, space heating, or absorption cooling.
✓Phase 5: Advanced Controls (Months 6-8)
Implement master controller sequencing, SCADA integration, and predictive maintenance. Optimize multi-compressor operation and enable data-driven continuous improvement.
✓Phase 6: Continuous Monitoring (Ongoing)
Establish monthly energy reporting, quarterly leak surveys, and annual system performance reviews. Maintain optimization gains and identify new opportunities.
The cumulative energy savings from implementing all phases typically reach 30-45% of baseline consumption. For a 200 kW system operating 6,000 hours annually at $0.12/kWh, this represents $43,000-$65,000 in annual savings—$430,000-$650,000 over 10 years. The total capital investment for all phases is $80,000-$150,000, yielding a simple payback of 1.5-3.5 years.
Ever-Power, recognized as a leading supplier of energy-efficient compressed air solutions for the packaging industry, provides comprehensive energy audit services, VSD upgrade packages, and heat recovery integration for its CM-PV and CM-G series compressors. The company’s regional engineering teams in Vietnam, Thailand, and Singapore support packaging plants across Asia-Pacific with site-specific optimization programs. For facilities seeking IBM-air compressor integration expertise, Ever-Power’s application engineers conduct on-site audits and deliver customized implementation roadmaps.
Frequently Asked Questions About IBM-Air Compressor Energy Optimization
How much energy can I save by adding VSD to my IBM blow molding compressor?
VSD upgrades typically reduce energy consumption by 20-30% for IBM applications with cyclical demand. The savings depend on your load profile—facilities with high demand variation (frequent mold changes, multiple machine sizes) achieve the greatest savings. A 100 kW fixed-speed compressor running at 60% average load factor consumes approximately 576,000 kWh annually. The same system with VSD consumes approximately 410,000 kWh annually—a savings of 166,000 kWh or $19,900 at $0.12/kWh. Payback period is 1.5-3 years depending on VSD premium and local electricity rates. For high-cycle IBM machines like the IBM175 replacement line, VSD payback is often under 2 years due to the extreme demand variation between blow cycles.
What is the minimum blow pressure for IBM machines, and how does it affect energy?
Minimum blow pressure depends on bottle size, material, wall thickness, and production speed. Small bottles (50-200 ml) may require only 25-28 bar. Large bottles (1-5 liters) or thin-wall designs may require 32-35 bar. Every 1 bar reduction below your current setpoint decreases compressor power by 6-8%. The optimization protocol is: conduct trials at incrementally lower pressures, inspect bottles for quality defects, and establish the minimum pressure that maintains specification. Then add 0.5 bar safety margin for system pressure drop. Many plants discover they can reduce pressure by 3-5 bar without quality impact, saving 18-40% on compressor energy. Never reduce pressure without quality verification—defective bottles cost far more than energy savings.
Can heat recovery from air compressors really offset heating costs?
Yes. Air compressors reject 60-80% of input energy as heat. A 100 kW compressor generates approximately 70 kW of recoverable heat. At 6,000 operating hours and $0.08/kWh heating value, annual heat recovery is worth $33,600. Water-cooled compressors are most effective for heat recovery because cooling water captures heat at 40-60°C—ideal for boiler feedwater preheating and process heating. Air-cooled systems can recover 40-60% of available heat through ducting and heat exchangers. The capital cost is $8,000-$15,000 with payback of 3-6 months. In cold climates, heat recovery can offset 50-80% of facility heating costs during winter months. Even in tropical climates, heat recovery for process water preheating delivers consistent year-round value.
How do I detect compressed air leaks in a high-pressure IBM system?
High-pressure leaks are detected using ultrasonic leak detectors that sense the ultrasonic frequencies (20-100 kHz) generated by turbulent air escaping through small openings. At 35 bar, a 3 mm leak consumes 12 kW of compressor power—$12,000 annually. Survey all connections, fittings, valves, and hoses quarterly. Common leak points include quick-disconnect fittings, hose crimps, valve packings, and filter bowl drains. Tag each leak with priority and repair within 30 days. Measure leak reduction by comparing compressor loaded hours before and after repair. A well-executed program reduces compressor load by 10-20%. For systems without ultrasonic equipment, measure total compressor output during a production shutdown (all machines off)—any flow indicates leaks. Divide by number of machines to estimate leak rate per production line.
Should I use one large compressor or multiple smaller compressors for my IBM line?
Multiple smaller compressors with intelligent sequencing are generally more efficient than one large compressor for IBM applications. A single large compressor running at 40% load is inefficient. Two compressors—one VSD base-load unit and one fixed-speed trim unit—operate each in their efficient range. The VSD handles variable demand while the fixed-speed unit runs fully loaded when activated. For plants with 3+ IBM machines, a master controller optimizes sequencing automatically. The exception is very large facilities (5,000+ bottles per hour) where a single large VSD screw compressor may be most efficient. The decision depends on your demand profile, redundancy requirements, and capital budget. Conduct a load duration analysis—plotting demand versus cumulative hours—to identify the optimal number and size of compressors.
What is the typical payback period for a complete energy optimization program?
Payback depends on implementation scope and baseline efficiency. Quick wins (leak repair, pressure reduction, filter cleaning) require minimal capital and pay back within 1-3 months. VSD upgrades pay back in 1.5-3 years. Heat recovery pays back in 3-6 months. A complete program implementing all phases typically achieves 30-45% energy reduction with an overall payback of 1.5-3.5 years. For a 200 kW system, total capital investment is $80,000-$150,000 and annual savings are $43,000-$65,000. Over 10 years, cumulative savings reach $430,000-$650,000. Facilities with older, inefficient compressors achieve the fastest payback because the baseline waste is largest. New facilities should specify energy-optimized systems from the outset to avoid retrofit costs.
Does energy optimization compromise air quality for IBM bottle production?
No. Energy optimization and air quality are independent dimensions when properly implemented. VSD control maintains discharge pressure within ±0.2 bar—tighter than fixed-speed load/unload control. Pressure reduction is bounded by quality verification trials. Heat recovery does not affect compressed air purity. Leak repair improves system pressure stability by reducing uncontrolled losses. The only interaction to monitor is filter maintenance—energy optimization programs must maintain filter replacement schedules to prevent breakthrough that compromises ISO 8573-1 Class 0 compliance. Reputable energy optimization programs include air quality monitoring as a parallel track, ensuring that efficiency gains never trade off against food safety requirements.
Conclusion: Energy Optimization as Competitive Advantage
The packaging industry operates on thin margins where every fraction of a cent per bottle matters. Compressed air energy represents 30-50% of total facility consumption in IBM-based packaging plants. Reducing that consumption by 30% through systematic optimization is not an environmental nicety—it is a direct margin improvement that strengthens competitive position.
The strategies presented in this guide—VSD integration, heat recovery, pressure optimization, leak management, and intelligent multi-compressor control—are proven, quantified, and immediately actionable. They require no breakthrough technology, only engineering discipline and capital investment that pays back within 2-3 years. The cumulative 10-year savings of $400,000-$650,000 for a typical 200 kW system dwarf the optimization investment.
Ever-Power, recognized as a leading energy-efficient compressed air supplier for the global packaging industry, supports its CM-PV and CM-G series compressors with comprehensive energy audit services, VSD retrofit packages, and heat recovery integration. The company’s regional engineering teams in Vietnam, Thailand, and Singapore provide on-site optimization support for packaging plants across Asia-Pacific. For facilities committed to reducing packaging energy costs through IBM-air compressor integration, Ever-Power delivers the technical expertise and aftermarket support that transform energy waste into competitive advantage.
The final message is direct: your current compressed air system is almost certainly wasting 25-40% of the energy it consumes. The technology to eliminate that waste exists, the economics are compelling, and the implementation roadmap is clear. The only missing ingredient is the decision to act. Measure your waste, prioritize your opportunities, and start with the quick wins that fund the larger investments. Your packaging operation—and your bottom line—will thank you for decades to come.